


- By Admin
-
 Return Analytics
-
 19 June, 2026
The Pattern Most Sellers Never See
Most Amazon sellers react the same way when returns start increasing. They blame the product. It's a logical assumption. If customers are sending items back, something must be wrong with the product itself.
So, they start making changes:
- Updating product descriptions
- Improving images
- Redesigning packaging
- Tweaking features
- Looking for manufacturing defects
Weeks pass. Money gets spent. Nothing has changed. Returns keep climbing, and that's because many sellers are trying to solve a problem that doesn't actually exist.
- What if your Amazon return rate isn't increasing because of your product?
- What if it's increasing because of a pattern, you simply can't see?
The Mistake That Costs Sellers Thousands
Imagine this scenario. Your Amazon returns rate jumps from 7% to 14%. Naturally, alarm bells start ringing.
You begin auditing everything:
- Product quality
- Customer reviews
- Listing content
- Packaging
- Pricing
But after weeks of investigation, you still can't find anything obviously wrong. The product works. Customers are happy. Reviews remain strong.
So why are returns increasing?
- The answer might be hiding in a pattern most sellers never see.
- Geography is one possibility.
- Customer sentiment is another.
Return reasons, buying behavior, and operational issues can all leave clues that are easy to miss when you're only looking at total return numbers.
The Seller Who Fixed the Wrong Problem
Let's say a seller receives 500 returns in a month. The immediate conclusion is:
"Something is wrong with the product."
So, they redesign the packaging. They rewrite the listing. They spend money on quality checks. The following month - returns barely move.
Frustrated, they finally dig deeper into the data. What they discover changes everything. Nearly 40% of all returns came from just five cities.
Even more interesting:
- Most were Cash on Delivery orders
- Damage-related complaints were significantly higher
- The same logistics routes appeared repeatedly
- Return rates in every other region remained normal
Suddenly, the problem looks very different. The product wasn't broken. The seller was simply solving the wrong problem.
Returns Don't Start in the Warehouse
Most sellers think returns begin when a customer clicks the "Return" button. Returns often begin much earlier. They begin the moment a customer's expectation is created. A misleading image. An unclear product description. A delivery promise that isn't met. A product shipped through a route where transit damage is common. By the time the customer receives the package, the return may already be set in motion. This is why understanding return patterns is so important.
Because returns are often the result of multiple operational and customer-driven factors working together-not just product quality.
Returns Aren't Always a Product Problem
Many sellers think of returns as a product metric. Returns are often a business metric. A logistics issue can look like a product issue. A regional delivery problem can look like a quality issue. A customer expectation gap can look like a manufacturing issue. Negative customer sentiment can reveal problems long before return rates spike. That's what makes returns so expensive.
Not just because they cost money. But because they often send sellers in the wrong direction. Some businesses spend months fixing products that were never the cause of the problem.
The Most Dangerous Return Metric on Your Dashboard
Most sellers track one number: Total Returns.
The problem - that number tells you almost nothing. Imagine your dashboard shows:
Returns Last Month: 500
What should you do next?
You don't know.
Because the number doesn't explain:
- Which products are driving returns
- Which regions generate the most returns
- Whether returns are linked to logistics networks
- What customers are saying
- Whether customer sentiment is becoming more negative
- Whether a recent listing change influenced customer expectations
Without context, a return number is just noise. The real value comes from understanding the pattern behind it.
The Hidden Patterns Behind Returns
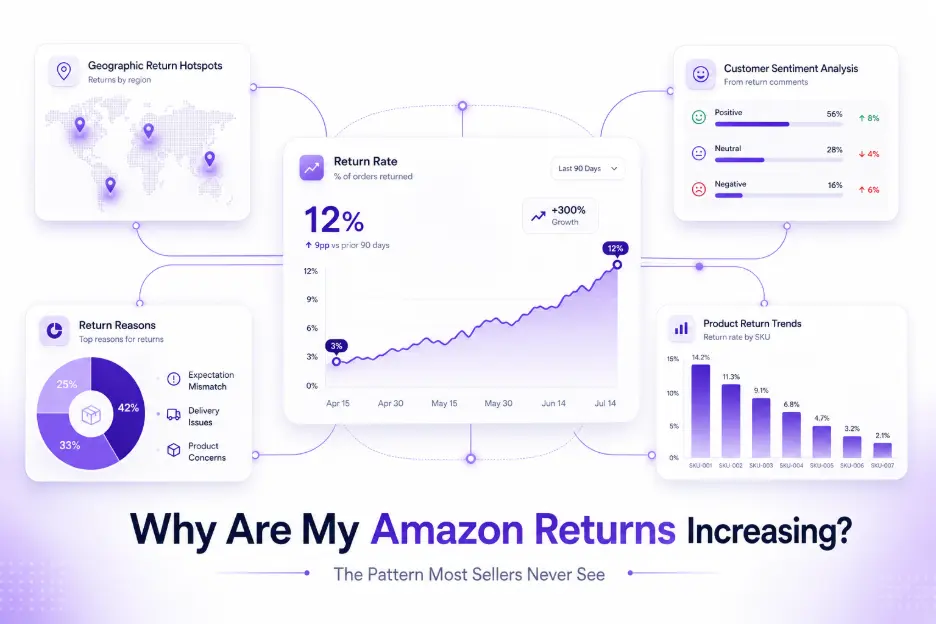
When sellers begin analyzing Amazon returns more deeply, surprising trends often emerge. For example: a product may have an overall Amazon return rate of 12%.
That sounds like a product issue.
But deeper analysis reveals:
- 4% return rate across most regions
- 28% return rate in a handful of cities
Or customer feedback reveals:
- Repeated complaints about sizing expectations
- Growing frustration around delivery delays
- Confusion caused by product descriptions
- Recurring concerns hidden within return comments
Now the conversation has changed.
Instead of asking:
"What's wrong with the product?"
You start asking:
"What's actually driving these returns?"
That's a far more useful question. Because the answer often points toward a specific issue that can be fixed. This is where Amazon return analytics become valuable. Not because they tell you how many returns happened. But because they help explain why they happened.
Why Returns Hurt More Than Most Sellers Realize
Most people think a return simply means losing a sale. Unfortunately, that's only the visible cost.
Every return creates a chain reaction:
- Reverse logistics expenses
- Refund processing costs
- Inventory inspection costs
- Potential product damage
- Additional storage fees
- Lost advertising spend
- Reduced profitability
A ₹1,000 return rarely costs just ₹1,000. The total impact is often much larger once every associated expense is considered. Which is why identifying the root cause matters so much.
Five Questions Every Seller Should Ask Before Blaming the Product
Before making product changes, ask yourself:
-
Which SKUs Generate the Highest Return Rates?
A small number of products often drive a disproportionate share of returns. -
Which Cities or Regions Generate the Most Returns?
Geographic patterns can reveal issues hidden beneath aggregate data. -
What Are Customers Actually Reporting?
Return reasons often expose expectation gaps, delivery damage, or operational issues. -
What Does Customer Sentiment Reveal?
Reviews, comments, and return feedback often uncover recurring issues before they become obvious in the numbers. -
Did Returns Increase After a Specific Change?
New images, pricing updates, promotions, or listing changes can influence customer behavior.
How eComSuite Helps
Most sellers know how many returns they received. Far fewer understand what's actually driving them.
A rising return rate can stem from multiple factors:
- Geographic trends
- Customer sentiment
- Product quality issues
- Listing expectation gaps
- Operational challenges
- Regional buying behavior
The challenge isn't collecting data. It's connecting the dots. eComSuite helps sellers move beyond return counts and uncover the patterns behind them by analyzing:
- Return-heavy regions and geographic trends
- Product-level return performance
- Customer return reasons
- Sentiment hidden within customer comments and feedback
- Sales versus return behavior across locations
- Emerging patterns that may impact profitability
This allows sellers to answer questions such as:
- Are returns concentrated in specific cities or regions?
- What are customers actually saying when they return products?
- Are customer comments revealing recurring issues?
- Is negative sentiment increasing before return rates rise?
- Which products are driving the majority of returns?
Instead of asking:
"Why are returns increasing?"
Sellers can start answering:
"What exactly is driving those returns?"
And that's where better decisions begin.
The Bottom Line Is
The most expensive return problem is often the one you misdiagnose. Many Amazon sellers assume rising returns mean a product issue. Sometimes they're right. But sometimes the real cause is hiding inside customer feedback, a logistics network, a specific region, or a behavioral pattern buried in the data. The businesses that improve profitability aren't always the ones with the fewest returns. They're the ones that understand exactly why those returns are happening. Because the goal isn't simple to reduce returns.
The goal is to understand them. Once you understand them, improving profitability becomes much easier.
Ready to uncover what's really driving your Amazon returns?
With eComSuite's Return Analytics and Geographic Insights, sellers can identify return-heavy regions, understand customer sentiment, uncover hidden operational issues, and make smarter decisions backed by data not assumptions.
Get Started
Sign Up - Free