


- By Admin
-
 Advertising
-
 26 September, 2026
Two sellers look at the same campaign report.
The first seller sees ACoS go up from 30% to 36%. Ads are getting more expensive, so he cuts the budget.
The second seller sees something else. Total sales went up by 50%, and TACoS stayed flat. The ads are working, so she keeps the budget.
Both of them read the data correctly. Only one of them made the right decision.
The difference is not skill. The difference is which metric they chose to trust.
Three Metrics, Three Different Questions
ACoS, ROAS and TACoS all use your ad spend. But each one answers a different question. When you ask the wrong metric the wrong question, you get a correct number and a wrong decision.
ACoS: Advertising Cost of Sales
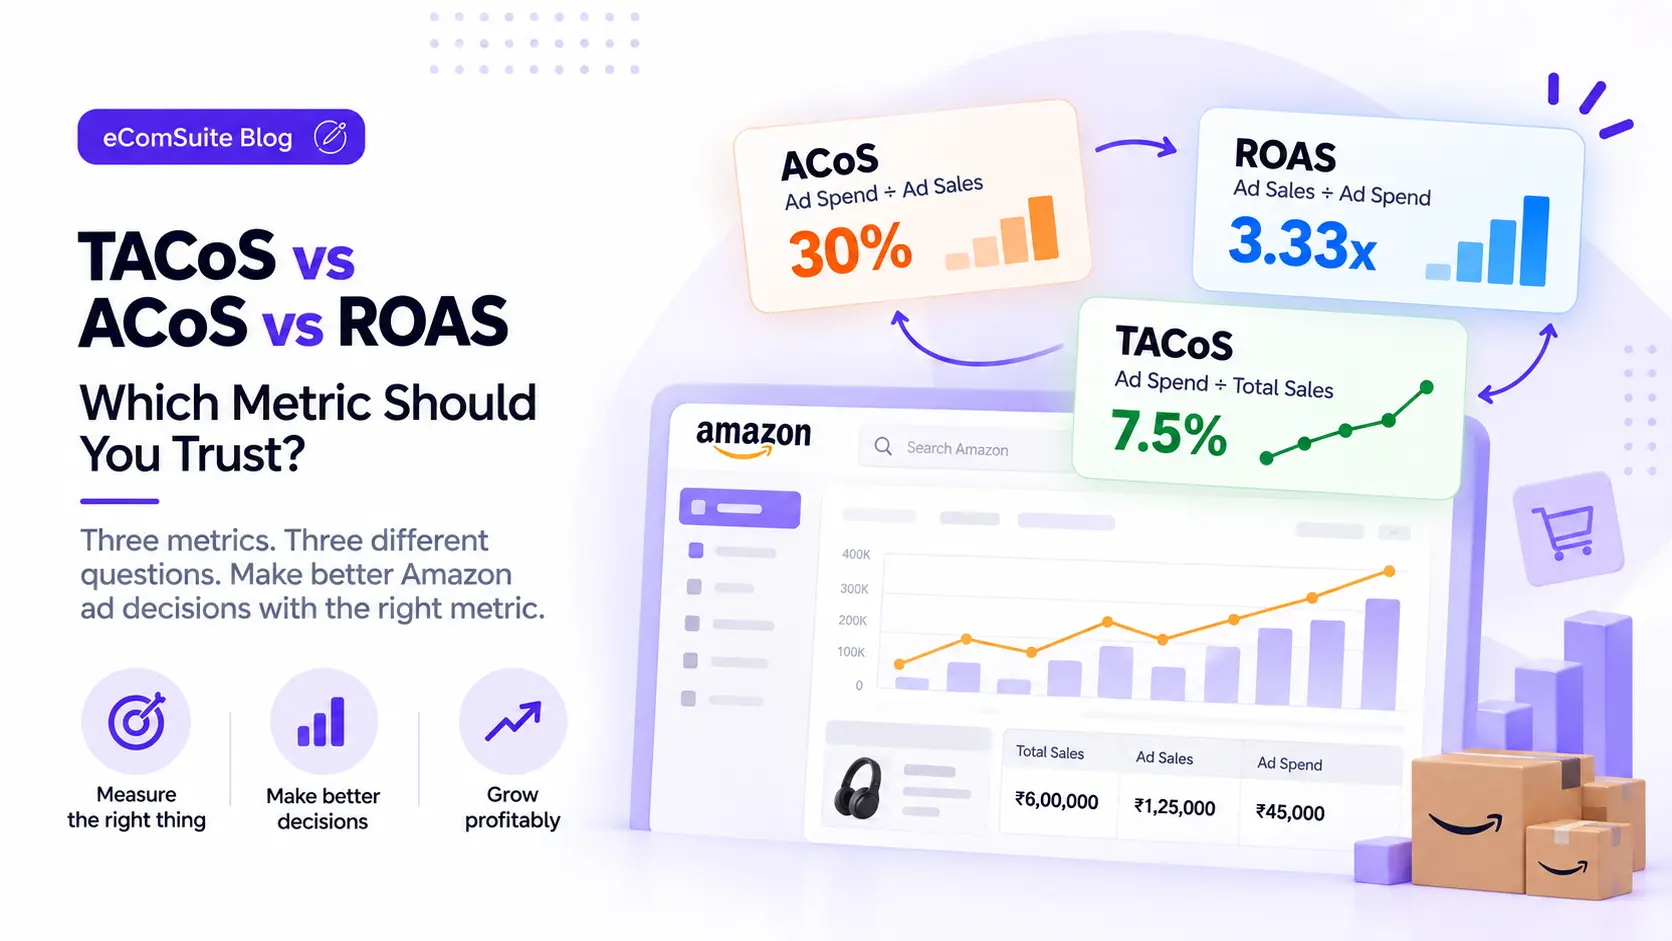
ACoS = Ad Spend ÷ Ad Sales × 100
Question it answers: "How much do I pay in ads for each rupee of ad-driven sales?"
If you spend ₹30,000 on ads and ads bring ₹1,00,000 in sales, your ACoS is 30%. Lower is better.
ROAS: Return on Ad Spend
ROAS = Ad Sales ÷ Ad Spend
Question it answers: "How many rupees of sales do I get for each ₹1 of ad spend?"
With the same numbers, ROAS is 3.33x. Higher is better.
ROAS is the inverse of ACoS. They tell the same story in different words. An ACoS of 25% is a ROAS of 4x. An ACoS of 50% is a ROAS of 2x. Use the one your team understands better, but do not treat them as two different signals.
TACoS: Total Advertising Cost of Sales
TACoS = Ad Spend ÷ Total Sales (ads + organic) × 100
Question it answers: "How much of my whole business depends on ad spend?"
If the same product had ₹4,00,000 in total sales, TACoS is 7.5%.
This is the key difference. ACoS and ROAS only look at sales that ads brought in. TACoS looks at all sales. That includes the organic sales that ads help to grow over time.
One Product, Three Answers
Here is one product over two months (sample numbers):
| Month 1 | Month 3 | |
| Ad Spend | ₹30,000 | ₹45,000 |
| Ad Sales | ₹1,00,000 | ₹1,25,000 |
| Total Sales | ₹4,00,000 | ₹6,00,000 |
| ACoS | 30% | 36% ↑ |
| ROAS | 3.33x | 2.78x ↓ |
| TACoS | 7.5% | 7.5% → |
If you look only at ACoS and ROAS, this product looks worse. Ads are less efficient.
If you look at TACoS, the story changes. Total sales grew by 50%. Ad spend as a share of the business did not change. The extra ad spend helped the product rank higher, and organic sales grew from ₹3,00,000 to ₹4,75,000.
Cutting this budget would save ₹15,000 in ads. It could also cost you part of the ₹1,75,000 in new organic sales.
ACoS told you the ads got more expensive. TACoS told you the ads were worth it.
When to Trust Which Metric
No metric is "the best". Each one is right for a specific job.
Use ACoS or ROAS for daily decisions.
Keyword bids, search terms, match types, and campaign structure. These are ad-level questions, so use ad-level metrics.
Use TACoS for business decisions.
Budget size, growth strategy, and how dependent you are on ads. These are business-level questions, so use a business-level metric.
Use the product stage to set your targets:
- Launch: high ACoS and high TACoS are normal. You are buying visibility and first reviews. Watch click-side metrics (CTR, CPC, impressions) more than profitability in the first weeks.
- Growth: ACoS can stay high, but TACoS should start to go down as organic sales increase.
- Mature: ACoS should be near or below your break-even point. TACoS should be low and stable.
One target ACoS for all your products is a common mistake. A launch product and a best-seller need different rules.
How to Read TACoS Trends
A single TACoS number tells you little. The trend together with ACoS tells you a lot.
| ACoS | TACoS | What it means |
| ↑ Up | ↓ Down | Good. Ads cost more, but they build organic sales. Common in growth stage. |
| ↓ Down | ↓ Down | Very good. Ads are efficient and organic sales grow. |
| ↓ Down | ↑ Up | Warning. Ads look efficient, but organic sales drop. Check rank, Buy Box, stock and reviews. |
| ↑ Up | ↑ Up | Problem. Ads cost more and do not create growth. Review targeting and budget now. |
The third row is the one most sellers miss. Good ACoS can hide a weak business. If organic sales fall, ads start to carry the whole product, and TACoS shows it before ACoS does.
A rising TACoS means your business depends more on ads. That is normal during a launch or a sale event like Prime Day or the Great Indian Festival, when you push ad spend on purpose. It becomes a problem when TACoS rises for many weeks and total sales do not grow. Then check organic rank, Buy Box, stock levels and reviews before you increase ad spend.
Common Mistakes
1. Judging ACoS without knowing your margin.
An ACoS of 35% is excellent for one product and a loss for another. The number means nothing until you compare it with your profit margin (see the next section).
2. Using one target for every product.
Launch products, best-sellers and low-margin items need different targets.
3. Judging new campaigns too early.
Amazon gives credit for a sale to the day of the click, not the day of the purchase. So recent days always look worse than they will be. Read more in our post Why Your New Campaign's ROAS Is Lying to You.
4. Checking TACoS daily.
TACoS moves with organic sales, and organic sales change slowly. Check it weekly or monthly, not daily.
5. Reading TACoS at account level only.
A strong best-seller can hide five weak products in an account total. Check TACoS per product when possible.
Break-Even ACoS: The Missing Link
This is the number that turns ACoS from a vanity metric into a profit metric.
Break-even ACoS = Profit margin before ad spend (%)
Example (sample numbers, selling price after GST):
| Per unit | |
| Selling price | ₹1,000 |
| Product cost (COGS) | − ₹450 |
| Amazon fees | − ₹200 |
| Shipping & packaging | − ₹100 |
| Profit before ads | ₹250 (25%) |
Your break-even ACoS is 25%.
- ACoS below 25%: each ad sale makes a profit.
- ACoS at 25%: each ad sale breaks even.
- ACoS above 25%: each ad sale loses money, unless the ads also grow organic sales. This is where TACoS decides if the loss is an investment or a leak.
So, what is a good ACoS on Amazon India?
There is no single good number that is correct for all sellers. A good ACoS is one below your break-even ACoS. A 20% ACoS is a loss for a product with a 15% margin. A 40% ACoS is a profit for a product with a 50% margin. For a launch product, an ACoS above break-even for a short, planned period can be acceptable, if TACoS shows that organic sales grow.
Your fees depend on category, price and fulfilment method. Use your real numbers from Seller Central, not these sample numbers.
Which Metric Should You Trust?
Trust all three, but for different questions:
- ACoS / ROAS: "Is this ad, keyword or campaign efficient?"
- Break-even ACoS: "Is this efficiency profitable for this product?"
- TACoS: "Are my ads growing the business, or is the business depending on ads?"
A seller who reads only ACoS optimizes ads. A seller who reads ACoS and TACoS together grows a business. TACoS is not more important than ACoS. It answers a bigger question. Use ACoS to fix your ads, and use TACoS to check if the fixes help the business.
How eComSuite Helps
A few parts of the platform are built to show these metrics together, not in separate reports.
- Business Overview Dashboard shows ROAS and TACoS next to Gross Revenue, Net Revenue, Ad Revenue and Ad Spend. You see ad efficiency and business impact on one screen.
- Organic vs Inorganic Revenue shows how much revenue comes from ads and how much comes without ads. This is the view that tells you if your TACoS trend is healthy.
- Things You Should Know alerts flag campaigns as underperforming when ROAS is below 2 and as a scale opportunity when ROAS is above 4, based on month-to-date performance against last month.
- Target Keyword Performance shows a 7-day rolling average ACoS next to daily ACoS for each keyword, so you do not react to one noisy day.
- Revenue → Net Revenue Breakdown and COGS in Inbound Shipments help you see fees, discounts and product cost, which are the inputs you need for break-even ACoS.
- Ad Pulse shows ROAS, ACoS, CVR and CTR by hour in a heatmap, and eComACT lets you schedule campaigns to run only in high-performing hours. This helps improve ROAS and TACoS together.
Read ACoS for your ads. Read TACoS for your business. Read them together for your decisions.
Want to see your ACoS, ROAS and TACoS on one dashboard?
Sign Up - Free